JIRA / Confluence Shorthands for #NoEstimates
As you were reading Albina Popova’s articles [1, 2 & 3] about #NoEstimates you might have wonder how you would do some kind of measuring without story points and explicit estimation. These JIRA and Confluence shorthands may help you:
JIRA
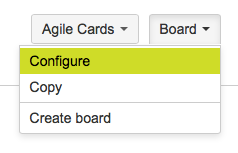
First of all, please open your Board Configuration by clicking “Board” in upper right corner and then “Configure”. Navigate to the “Estimation” Tab on the left column. Here select “Issue Count”.
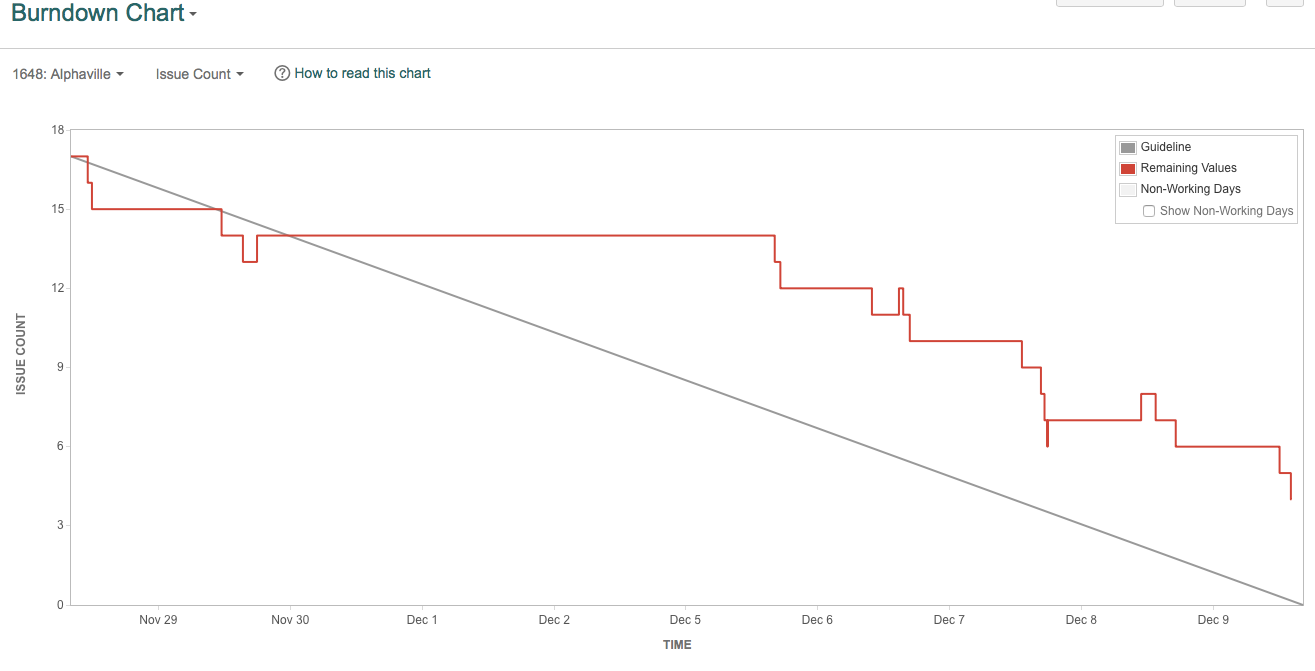
Burndown Chart
This has the impact, that “Issue Count” is default option for Burndown-Charts from now on. And this is as helpful as Story Point Burndowns were. They’re a pretty good indicator, how your sprint is working out. But: please underscore indicator! It’s only your breakpoint to ask the team, it’s far from an precise evidence.
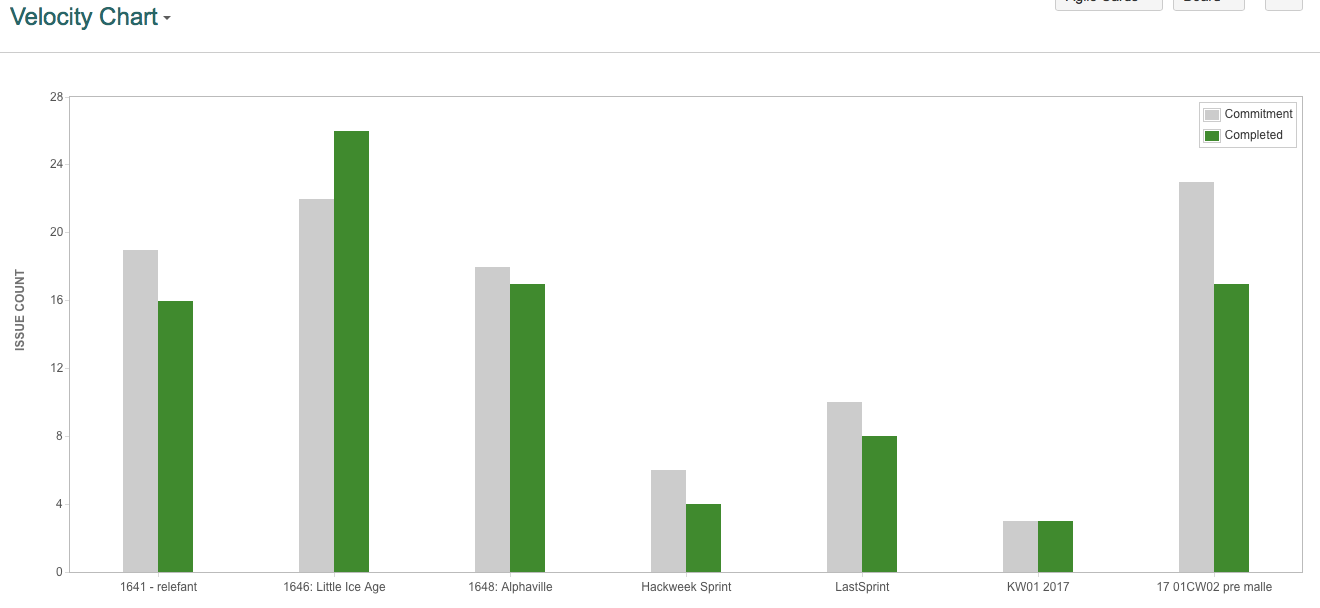
Velocity Chart
Without the config tweak above mentioned your Velocity Chart was pretty useless without using story points. Instead of Burndown Chart where you can choose “Issue Count” from dropdown, here at Velocity this is not possible. Now you have a quick view on how much issues your team has committed and completed in the last few sprints.
Before I personally figured this out, my hack was a JQL I fired every sprint and added a row in a Confluence table and visualized it via Confluence’s Chart-Macro.
Confluence
JIRA-Chart macro
This is also available in JIRA, but I personally find it more useful in a Confluence status page, so POs and Team visits and sees it more often. I really like the JIRA-Chart macro, esp. the “Created vs. Resolved” variant. If you configure it like this, you can get some information out of this (esp. interesting for Kanban-Teams, where Burndowns and Velocity Charts don’t apply).
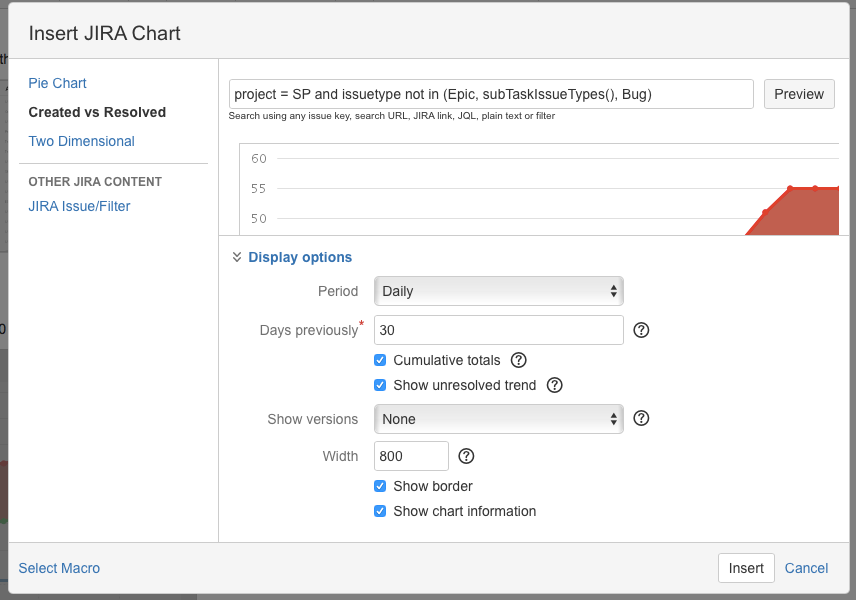
What you get out of this, these two examples of two teams might show you.
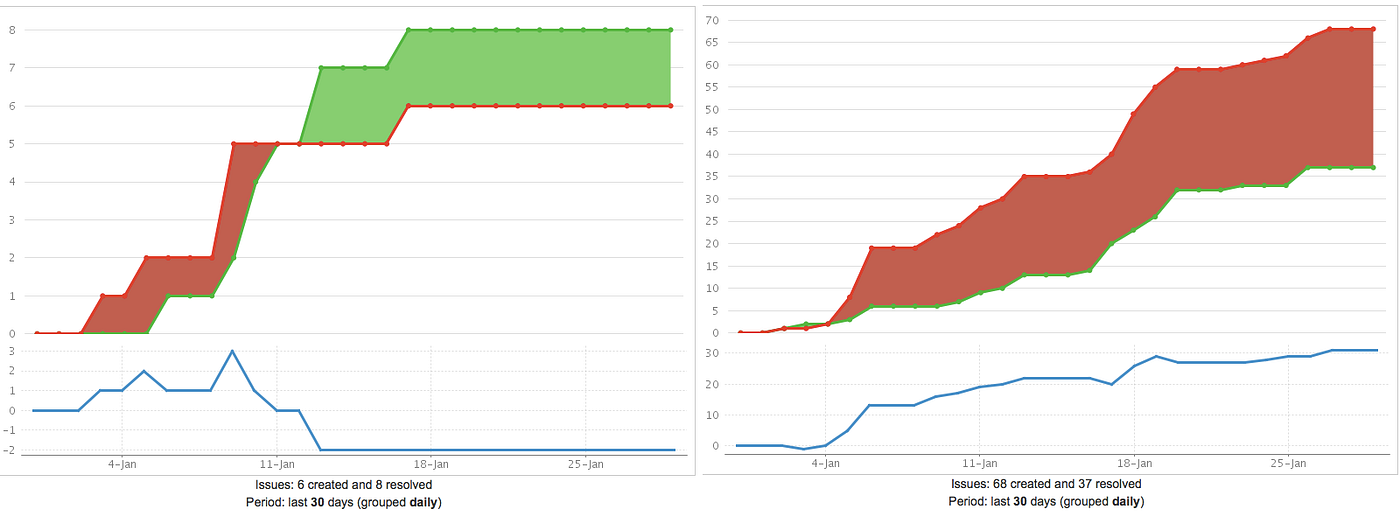
On the left a Kanban team which is in a good flow (which you can see form the negative created vs. resolved ratio) and on the right a Scrum team which is at the beginning of a project and not so good with focus and finish. Created vs. resolved ratio is positive and increasing.
Chart-Macro
This is not a special hint for NoEstimate measurement stuff in Confluence, but a very helpful with visualizing data in Confluence in general, I sometimes use to plot some numbers in graphs. The Chart-Macro is definitely no low hanging fruit to swallow, learning curve is like using LaTeX… But as I struggled in the beginning, I for now don’t want to miss this macro by now.
So, if you figure out some other numbers via JIRA, Excel or so, you might just throw them in Confluence and show them.
Conclusion
I hope these few hints did the trick for you, if they were new to you. If you have questions, comments or other interesting stuff regarding this topic, pls. drop me a note below.
Thanks for reading. ?